Benchmark Your S&OP Process – Survey Results, 2017
 Results from Nexview’s 3rd annual Key Topics in S&OP are now available for download, here are some highlights.
The survey covers:
- Sponsorship
- Design elements
- Challenges people are having
- Results they’re getting
- Strategic topics being discussed in S&OP
- S&OP maturity
- IT Enablement
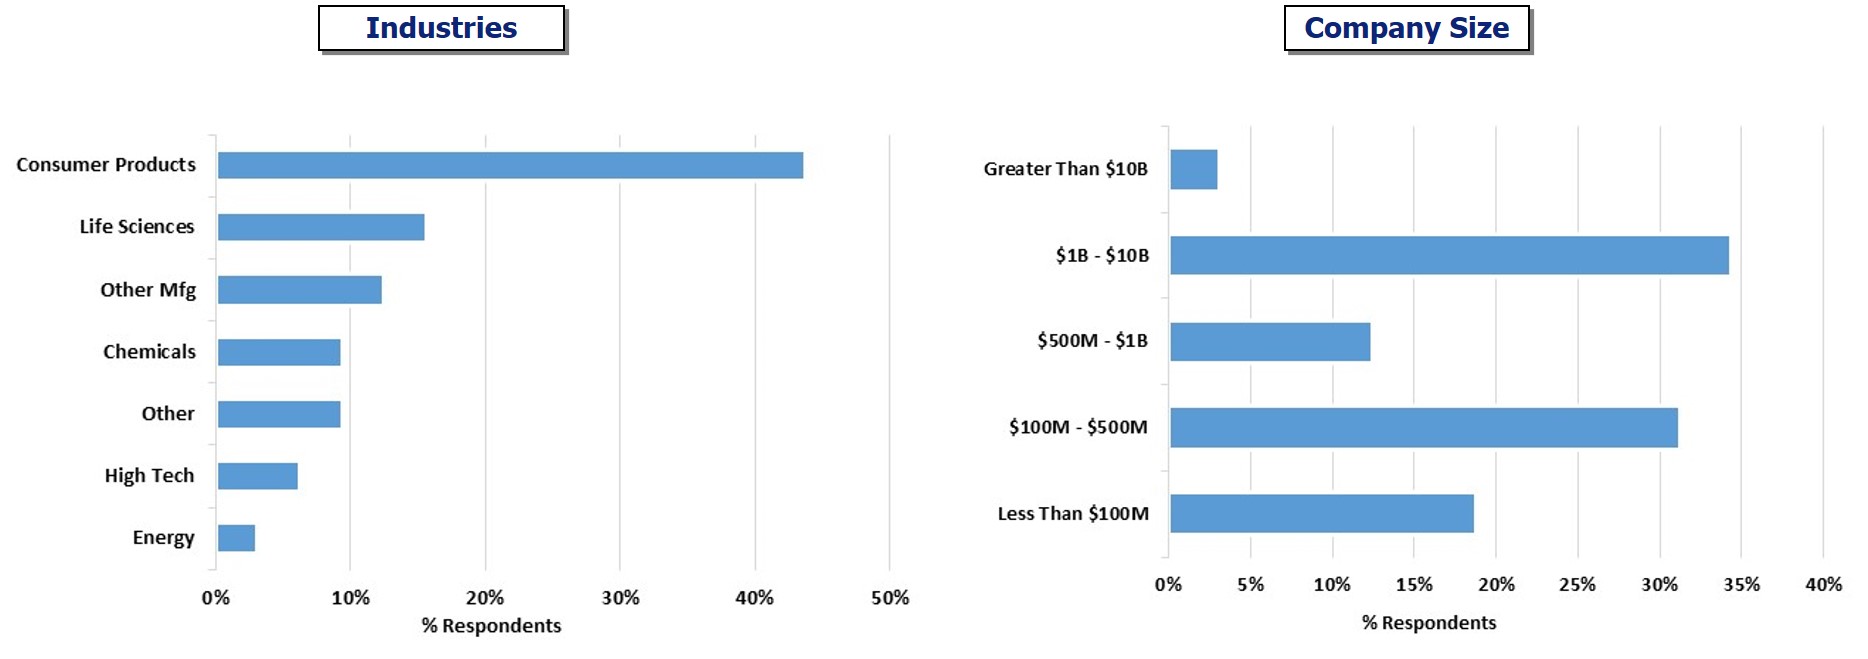
We had 32 participating companies this year representing industries such as consumer products, life sciences, high tech, chemicals, energy, and other manufacturing. As always we like a range of company sizes and this year was no different with companies ranging from less than $100MM to greater than $10B in revenues. Respondents ranged from CXO to individual contributor levels.
Here’s the summary:
- Consumer products companies made up the bulk of respondents this year (44%) with a good balance of large and medium-sized companies
- 61% of processes are sponsored at the executive level, yet executive support is reported as a top challenge
- Nearly half of respondents report overall results improvement above 10%, with 26% reporting results improvement above 20%
- Responses showing S&OP to be an effective vehicle for growth are high this year. Over 25% of respondents report improvements in sales and/or margins attributable to S&OP
- Communication, accountability, teamwork, and decision making are the highest ranking intangible benefits
- Finance integration is better this year, about 65% of companies have some level of finance integration
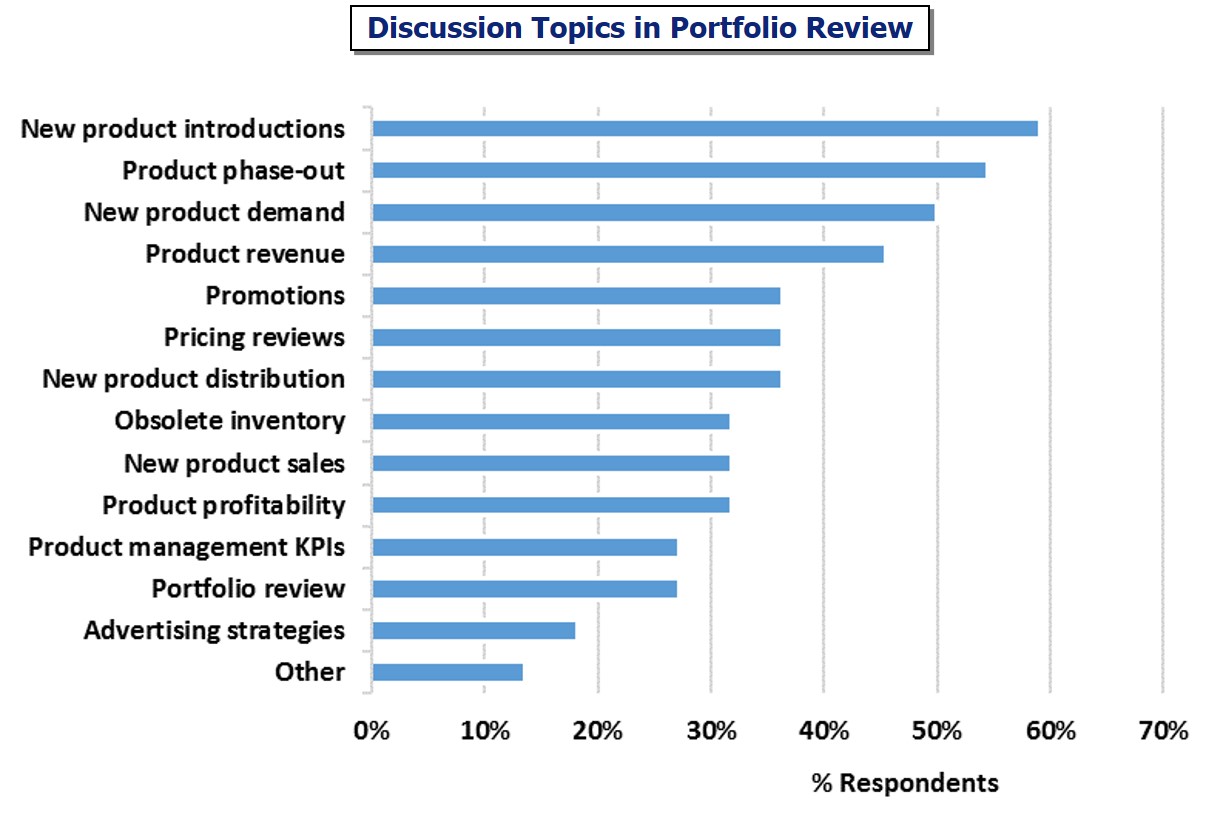
- Integration of Portfolio Management is also improved this year, 61% of companies have it and are discussing a variety of topics in the meeting
- While several companies reported using S&OP for more than balancing demand and supply as shown by the breadth of strategic topics reported being discussed, half of all respondents felt their processes were at a “Basic” level of maturity overall
- Companies report some advanced capabilities being provided by their IT tools, but most feel that their current IT use and tools are inadequate
We have several questions that are aimed at providing specifics. As an example, the chart below shows what companies are doing in Portfolio Review. We’ve also got charts like this on Strategic Topics Discussed in S&OP, IT Capabilities, and respondents’ views of their S&OP Process Maturity against our criteria.
Please download the final report if you’d like to see the charts and comments.
Next year’s survey is also live on the download page, if you’d like to participate or look at the questions. There are a few responses in there already and as always, you’ll get immediate feedback based on these responses, and a cleaned-up full report next year.