Findings from the Key Topics in S&OP Survey – 2015
This year we had some different results than what prior surveys have shown and also different from what is often talked about in many S&OP articles. Interesting.
Comments on the sample
The cross-industry survey included 27 companies varying in size from less than $100MM in revenues to over $10B USD. Not a huge sample, but most of our responses were collected in person and about half of them were completed by those at or above the VP level. Thus, I’m happy with the data set and found some of the results interesting. We also had several respondents in the less than $100MM category which is good to know that some smaller companies are doing S&OP too!
What it covered
We call it the “Key Topics” survey because it covers the dimensions that we believe are not only interesting, but also important to S&OP success. The survey included questions covering:
- Where companies are struggling
- Sponsorship
- Elements of the design
- Results
- Enabling IT
Without making the survey longer, we added a couple more questions for the 2016 version covering two more important areas (see below). Read on to see a brief conclusion on each of the above topics and/or download the full results summary with our comments.
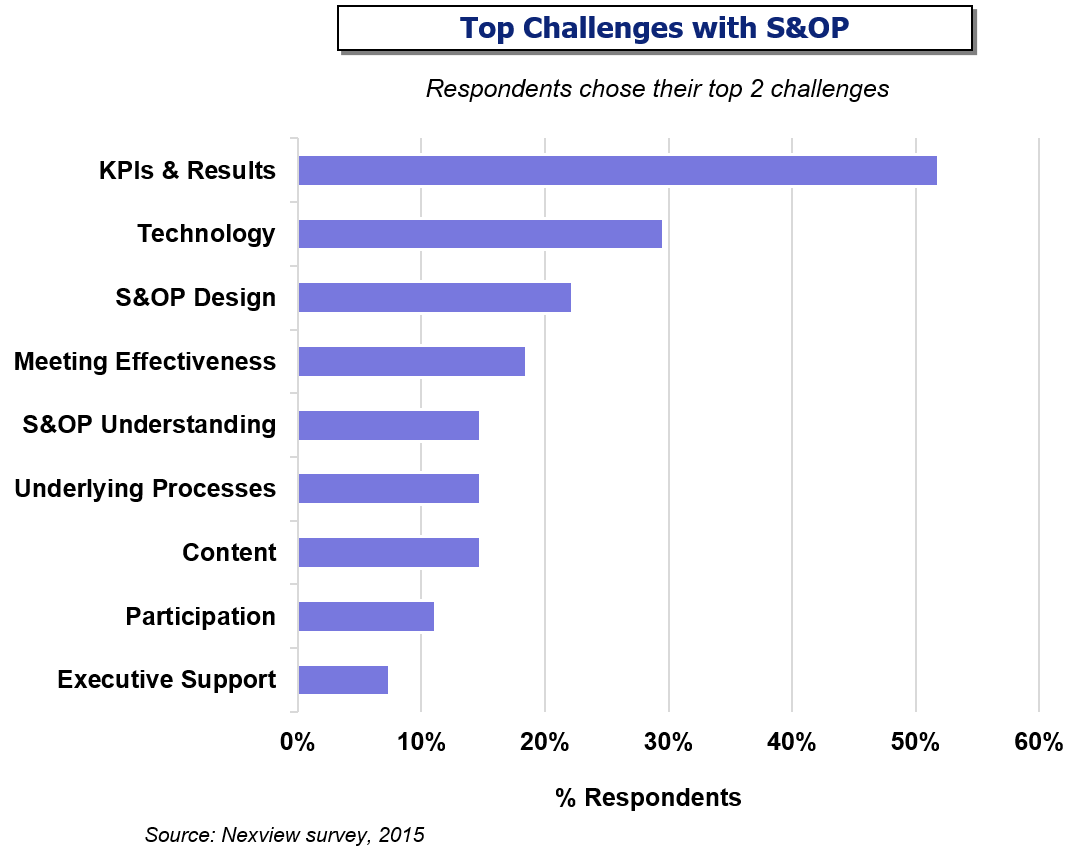
Top Challenges
Top challenges were KPI & RESULTS MANAGEMENT (a single choice) and TECHNOLOGY. I thought the former was interesting as it was an area we emphasized this year culminating in the publication of my first book, “Sales & Operations Planning RESULTS”. Note that “Executive Support” and “Participation”, while frequent gaps pointed out in the blogosphere/media, aren’t top choices. In fact, these were the least reported challenges. Perhaps because we interviewed the right executives. I think there are certainly still plenty of issues out there with the uninitiated, but I also believe that group is shrinking in established companies (at least in manufacturing ones). The technology response is consistent with Nexview experience, as it’s been a source of some grey hair over the years.
Sponsorship
CEO/GM was the top response with 78% reporting sponsors at the director level and above. If your sponsor isn’t at least a VP, it’s likely that S&OP is not the true decision making vehicle in the company.
Elements of the design
Financial integration wasn’t as strong this year, and integration of new products and portfolio management with S&OP remains a large gap. This was disappointing as 40% of respondents were from consumer products companies. Since CPG companies usually have lots of SKUs and dynamic portfolios, the integration of product development/management with the rest of the company can often be a challenge. A structured portfolio review as a regular component of S&OP would many. For those respondents who do have a portfolio review, the survey will show what they do in this meeting.
Results
Most are getting movement in KPIs in the 0-10% range. We’ve seen higher in prior years. The full summary goes into more detail regarding which KPIs/$ areas and the corresponding improvement levels.
Enabling IT
Most respondents only have what I call basic functionality to support S&OP, largely consisting of report support and KPI scorecard preparation supported by ERP. Profitability scenario modeling with advanced tools is part of what will be required to get you on the leader board here.
Download the full results summary to see charts and more comments on each section.
The 2016 Key Topics survey
We are committed to keeping surveys short and with the plethora of survey favor-askers out there, I believe you should get some value for filling one out. Immediate automated feedback and a download link to the 2015 results summary is the carrot this time for those who have 5 minutes to complete it anonymously (i.e. no email required). For those who decide to leave an email address, they’ll get the 2016 summary too at year end. I also invite my consulting and software provider colleagues to think of a client and complete it. I’ll emphasize anonymity again and results are only shown in the aggregate similar to the figure above.
Since S&OP is usually a work-in-progress, and most of us are interested in advancing to the bigger decisions, we added questions on S&OP maturity and strategic topics being discussed and decided upon through the process. During implementations, we always gain consensus on the types of strategic decisions that will be made in various parts of S&OP. It helps create the vision for what S&OP will do and sets the expectation for using the process when these things come up.
These are both good topics to benchmark where you are and perhaps provide some suggestions for your next area of improvement.
Check out the 2016 questions and we welcome your participation in the 2016 survey, as well as any comments on your experiences regarding the above.